
 Welcome to the first of a six-part series designed to help entrepreneurs evaluate their small businesses. It’s written by William M. Hand, President of PC Assistants, Inc., in Brookfield, Wisconsin.
Part I – Gauging Performance
Be prepared. You will certainly encounter many challenges along the way if you have decided to start your own business. Some of those challenges have to do with the actual running of the business, while others will come from the likes of government agencies, landlords, staff, partners, vendors, competitors, bankers, technology providers, community groups, media, family, and friends.
Having spent the first year or so putting systems in place for these challenges, many entrepreneurs might expect things to flow smoothly from that point on. Frequently, they don’t. As you get further into running your business, it’s always a good idea to set aside time to evaluate how things are progressing, address problems, work out kinks, develop systems, and keep your business in alignment with your goals.
One effective way to gauge performance is by tracking sales and profit. Many businesses rely on daily, weekly, or monthly sales reports, which provide structured, numerical snapshots of performance over fixed periods. While those reports are valuable, I’ve found success with a graphic approach tailored to the temporal nature of a business. This method visualizes trends and patterns over time, offering a more intuitive and dynamic perspective on how the business is evolving.
For example, a seasonal business centered around holidays will have very predictable peaks. In contrast, a business with steady, ongoing operations not heavily influenced by the time of year benefits from analyzing blocks of time segmented into, say, one- to two-week intervals.
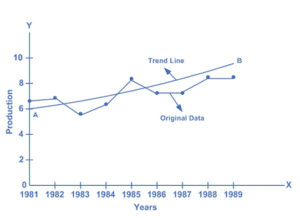
Sample Trend Line From BabyPips.com
Here’s why that segmentation works: Too much data can be confusing, distracting, or misleading. While it’s important to track data at a rate that matches your transaction frequency, identifying trends is equally critical. Trends, however, are difficult to discern from daily, weekly, or monthly snapshots alone. To address this, I take weekly data and calculate a trend line by averaging sales over three to seven days. This approach smoothes out short-term fluctuations and provides a clearer view of overall trends. It’s a helpful tool to help focus more on the big picture.
By taking time to gauge your performance, you can identify opportunities and challenges early, allowing you to make adjustments before they grow into bigger problems. In Part II, we’ll explore the early warning signs that every small business owner should watch for to stay ahead of potential issues.
~ William M. Hand

William M. Hand, President, PC Assistants, Inc.
Remote and On-Site Computer Support for Office and Home
(262) 853-4089
[email protected]